Chapter 8
Demographic Reports
Understanding where your traffic is coming from is an important first step for setting up your Analytics account. Once you know your main traffic sources and areas of opportunity, you can advance into analyzing your visitors and their demographics.
Demographic and Interest reports can give you an insight into your website users beyond their behavior on your site. Data points like age, location and affinity categories can help guide your marketing strategy to target certain groups.
Enabling Demographic Reports in Google Analytics
Demographic reports can be enabled in your Admin panel:
- Under Property > Property Settings > Advertising Features, enable Demographic Reporting.
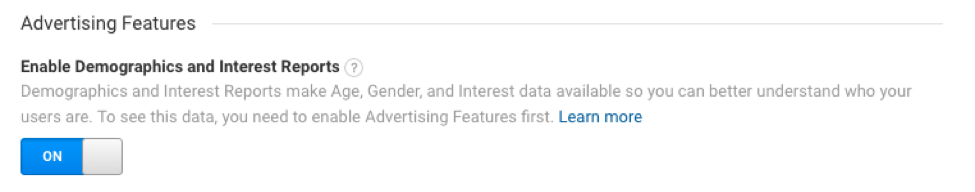
Once you have this enabled, you'll start collecting data. Demographic information is not historical, so you will start seeing data from the moment you enable reporting. It's recommended that you wait 1-2 weeks before analyzing your reports.
Categories of Demographic Reporting
Your demographic data will collect four datasets: Age, Gender, Geography and Interests. We'll explore how each of these sets looks in Analytics and how you can use this data for marketing and site improvement.
Overview
The Demographics Overview tab is a helpful snapshot for overseeing your general visitor profile. It shows Age breakdown on the left and Gender breakdown on the right:
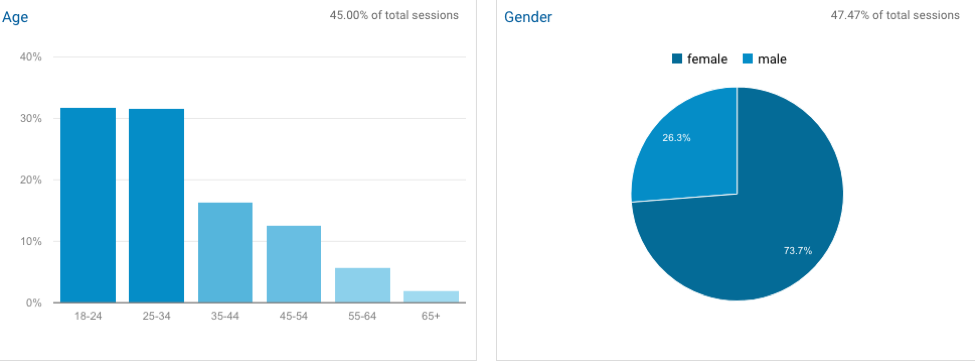
Each box shows the percentage of data used to report on demographics. This represents the size of your data set based on your total visitors for the time period you select.
In addition, you might see a notice at the top right of your report:

Make sure your report is enabled for 100% of sessions so your data is accurate.
You have options to review additional metrics from the Overview tab:
- % New Sessions: Review your audience after targeted advertising campaigns or major changes
- Average Session Duration: See how much time your demographic groups spend on your site
- Bounce Rate & Pages per Session: Explore how your groups engage with your site
Age
The age report will break down the age ranges of your site visitors:
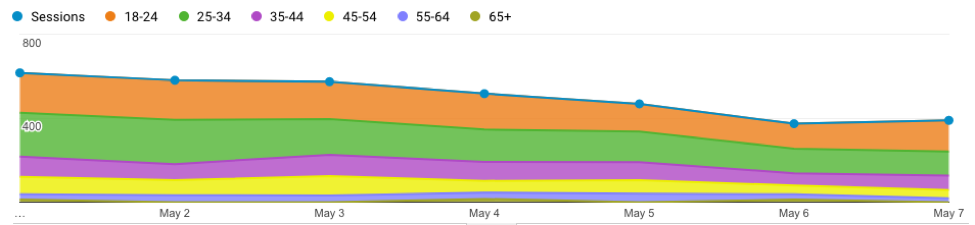
The graph helps you see age differences over time, so you can spot longer trends or short-term anomalies. This is especially helpful if you use a platform that allows age targeting, like Facebook Ads or YouTube.
The breakdown report gives more insight into new sessions and engagement, so you can find opportunities over time:
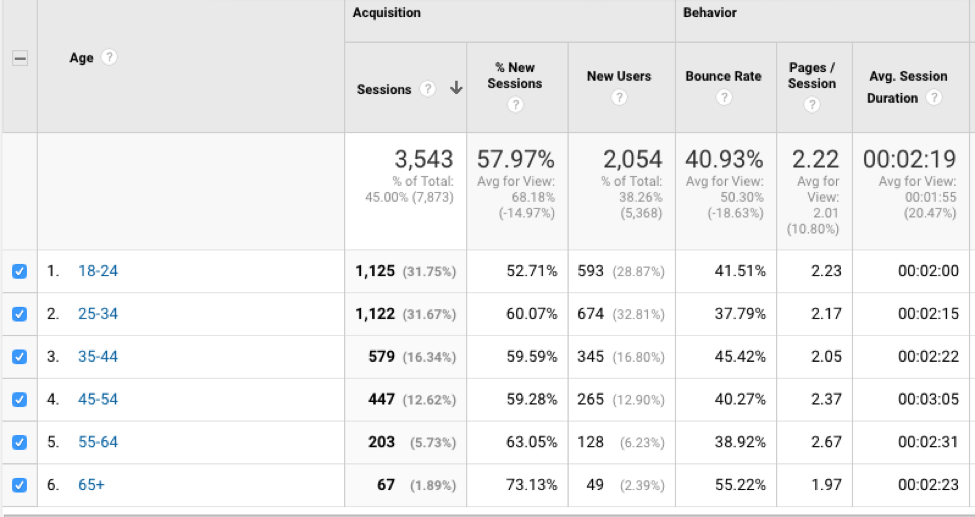
You can drill down into each group to find how your top groups navigate the site, top content for each group and more. It's helpful to create advanced segments for each group, so you can easily explore the top traffic channels for each group and content patterns.
Gender
Gender breakdowns are especially helpful in understanding your core demographic:
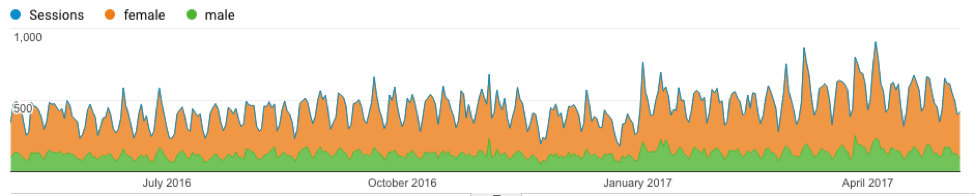
Over time, you can see if gender groups fall off or increase in sessions. This, along with age data, can help guide your marketing strategy and product development.
Like the Age groups, you'll want to create Advanced Segments for both gender groups to dive into their traffic sources and patterns.
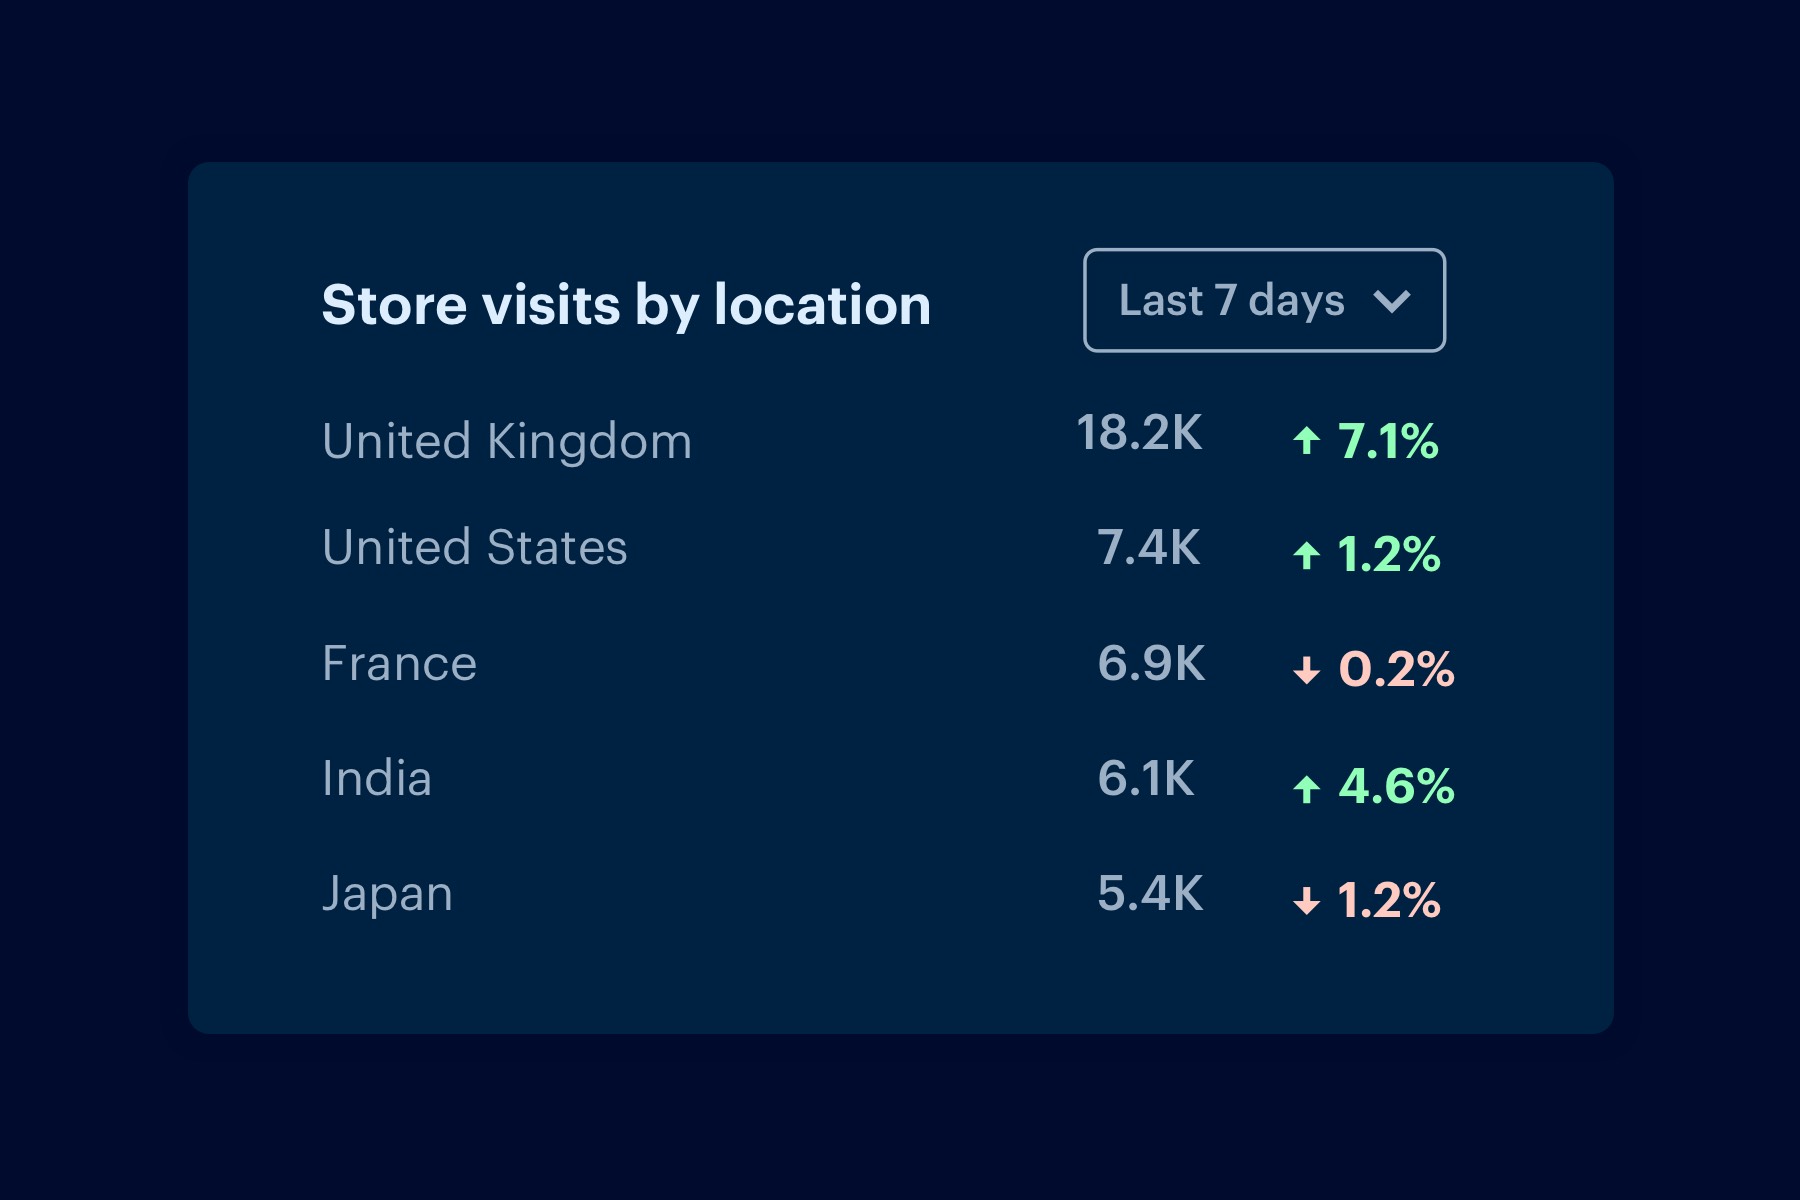
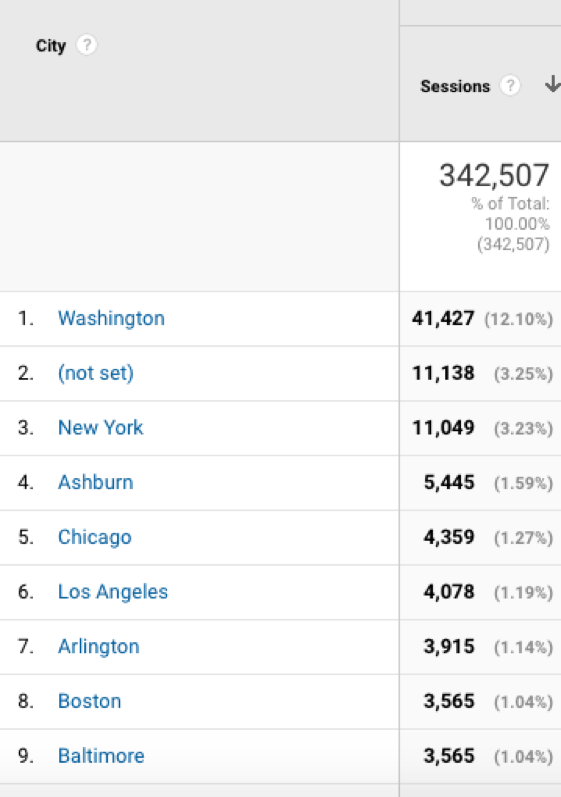
Geography
The geographic reports can be broken down by Language or Location, then Country, City and Continent within Location:
If you're an international company, the "Country" report is a helpful breakdown to see where the bulk of your traffic is coming from, and where you might be missing opportunities. If a country has higher bounce rates or less engagement, you might want to research creating a new site with content curated for that area and language.
The city breakdown is also helpful for hyper-local targeting. If you are aiming to expand, specific content for certain cities can be helpful in attracting visitors from these areas.
Interests
Interest categories go beyond age and gender to bring a deeper insight to your users and their behavior off your site. Understanding their interest outside of your content and product can help you develop a more sophisticated marketing plan and identify additional markets for better visibility.
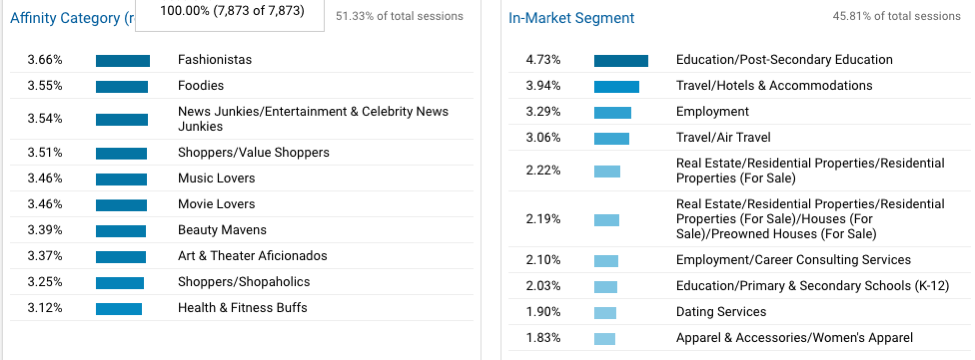
The Interest tab includes four reports:
- Overview: Shows a top ten list and percentage breakdown of the main categories
- Affinity Categories: Breaks down users by their top-level interests based on browsing habits and site categories (i.e. "music lovers")
- In-Market Segments: Shows the categories and sub-categories for what your users may be looking to buy or subscribe to elsewhere
- Other Categories: Groups users by content and browsing preferences
Analyzing Demographic Data
In addition to viewing these reports in the Demographics tab, creating Advanced Segments can help you not only drill down into this data, but analyze and apply it to your marketing strategy by:
- Identifying new and missed opportunities
- Showing profit areas to focus budget for ROI
- Creating specific re-marketing lists for segments
This data expands beyond your typical site traffic and engagement numbers to help you deep dive into the users on your site.