Chapter 10
Creating Custom Dashboards
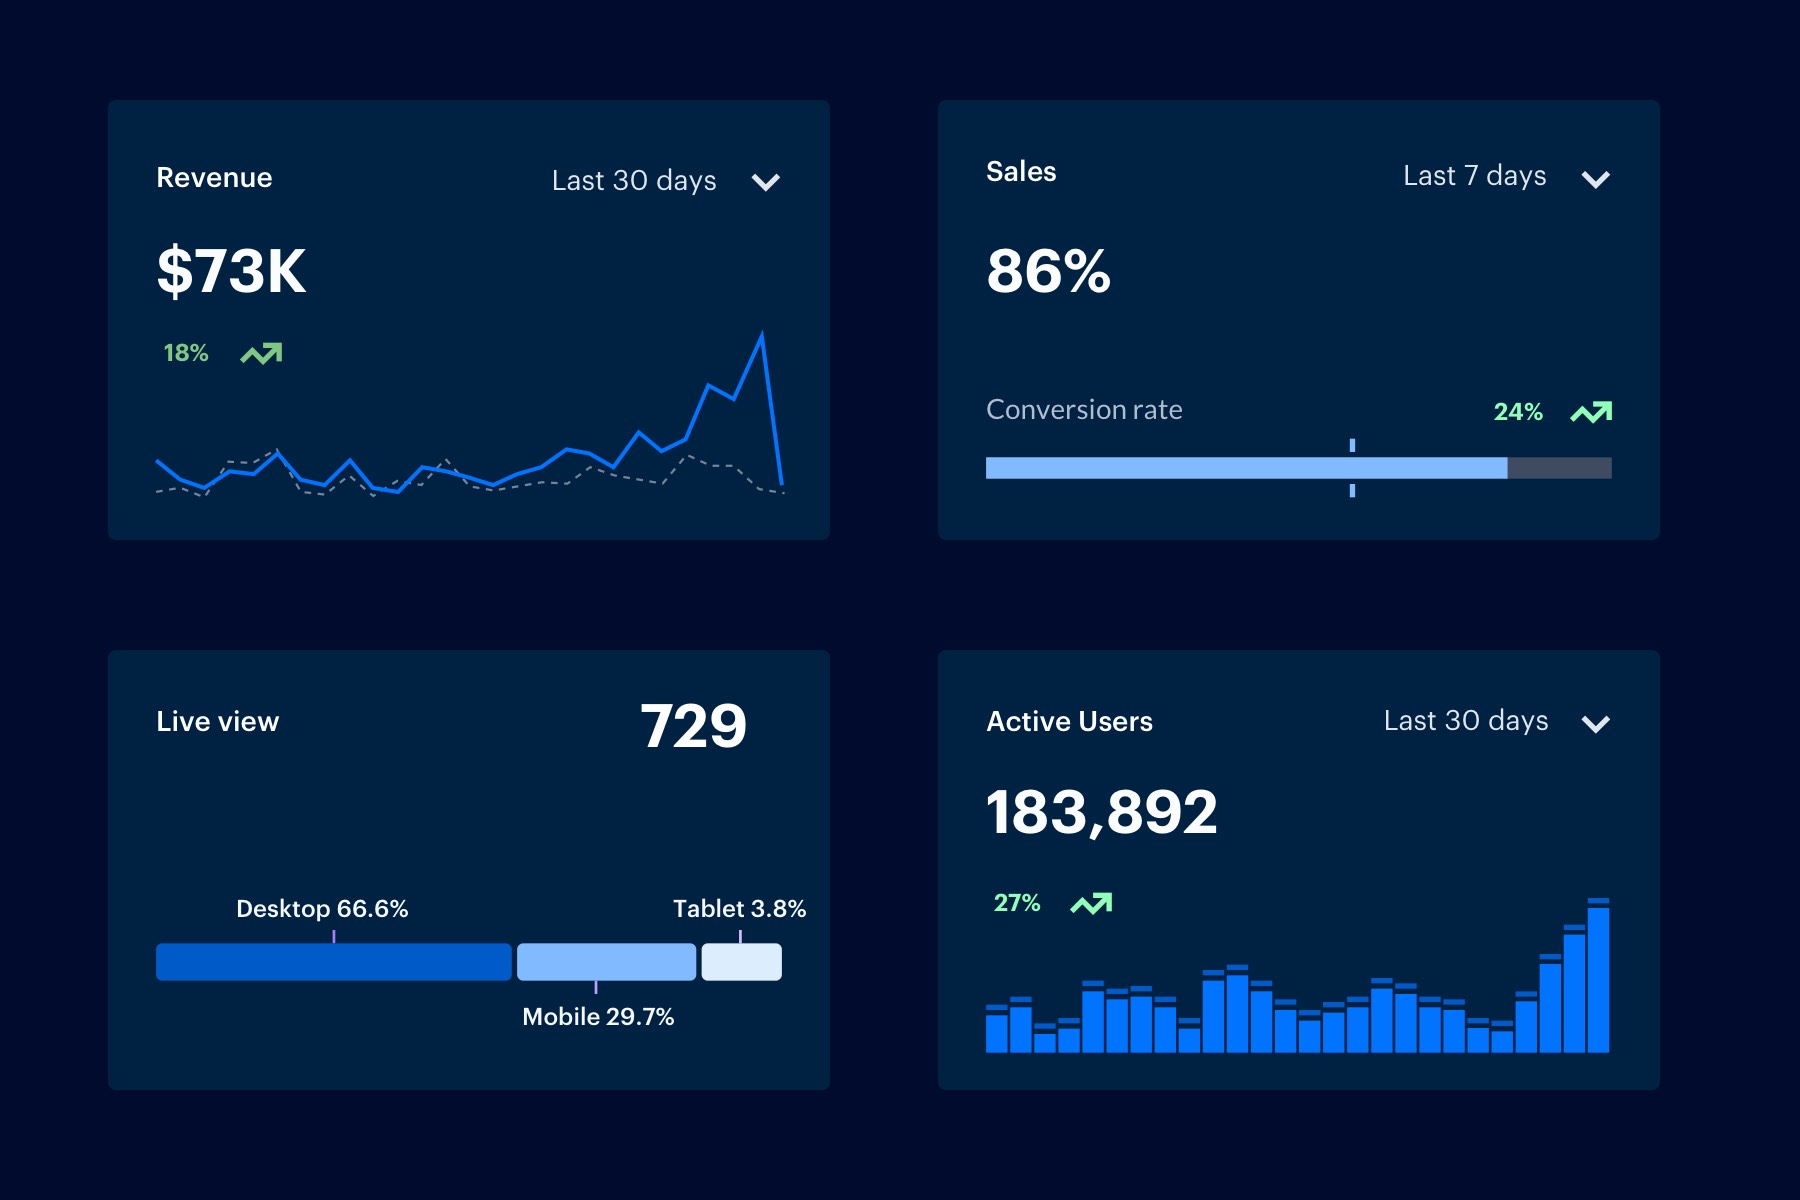
Once you've learned how to read your Google Analytics data, and exactly which data points matter for your website, you'll want to utilize custom dashboards to visualize this information at a glance.
Creating dashboards is a simple way to organize your data for certain campaigns, or to quickly compare traffic numbers month over month or year over year. Dashboards are also helpful if you have employees or shareholders that want to review numbers, but don't use Google Analytics every day.
Every view in Google Analytics comes with a default dashboard, but you can add up to 20 dashboards in each view. Each dashboard can contain up to 12 widgets.
Setting Up Dashboards
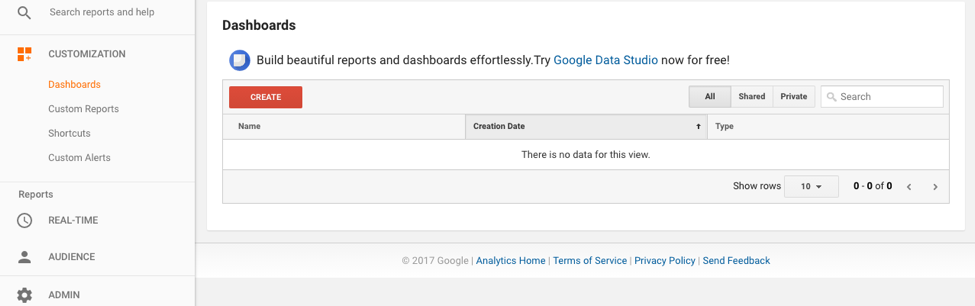
To set up your dashboard, go to Customization > Dashboards. There you'll click Create to start a new dashboard:
In the Create Dashboard dialog, select either Blank Canvas (no widgets) or Starter Dashboard (default set of widgets).
The default widgets will show:
- New Users
- All Users
- Sessions
- Sessions by Browser
- Avg. Session Duration / Pages by Session
- Bounce Rate
- Goal Completions
- Revenue
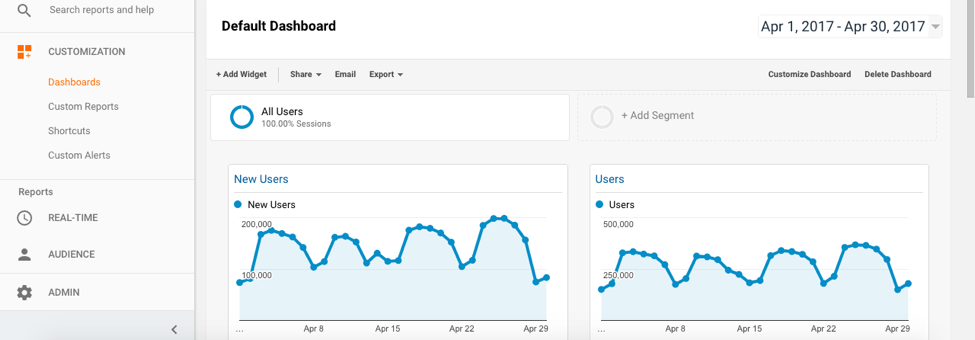
You can adjust the length of time of your snapshot and your advanced segment if you want to compare month over month, or just see organic traffic at a glance.
The type of widgets on your dashboard can vary in their display:
- Metric: Numeric representation of data
- Timeline: Graph of the selected metric over time
- Geomap: Maps the metric by geographic region
- Table: Displays two metrics in table form
- Pie: Pie chart of metric segmented by dimension
- Bar: Bar chart of metric and up to two dimensions
You can also include Real-Time widgets, which will show active data:
Timeline: Pageviews on the site for the past 30-60 minutes Table: Table of selected users and up to three dimensions Counter: Numerical count of active users in real-time Geomap: Real-time geography of active users
Adding New Widgets to a Dashboard
In addition to the default widgets, you can add other data points with widgets.
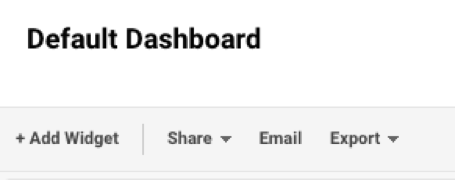
- Click "+ Add Widget" on your existing dashboard:
- Choose your type of widget and configure the metrics and dimensions. For this example, we'll create a widget for Unique Pageviews from organic traffic only:
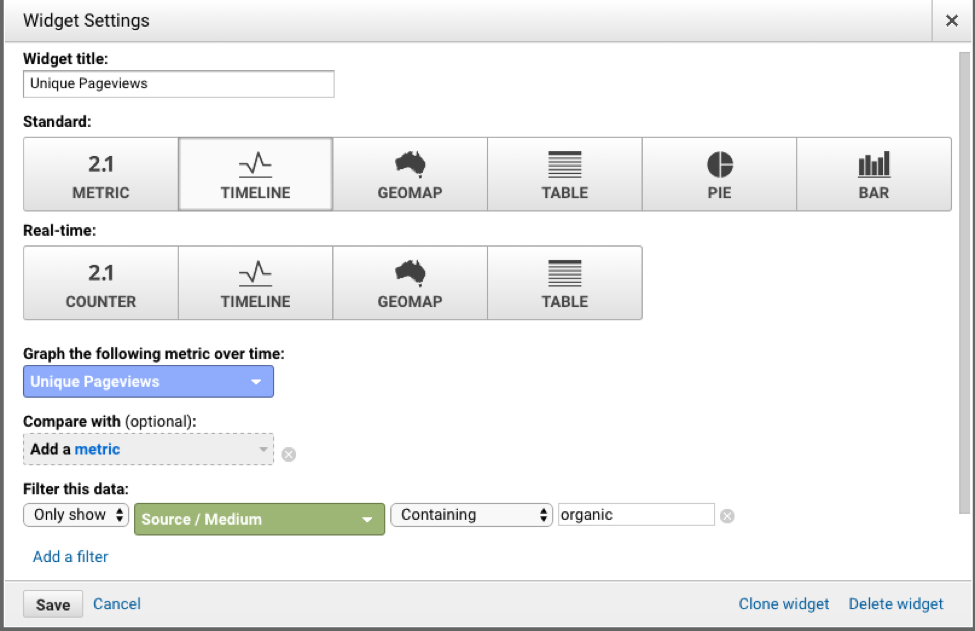
You can choose a unique title, or click Save. The widget will appear at the bottom of your existing dashboard.
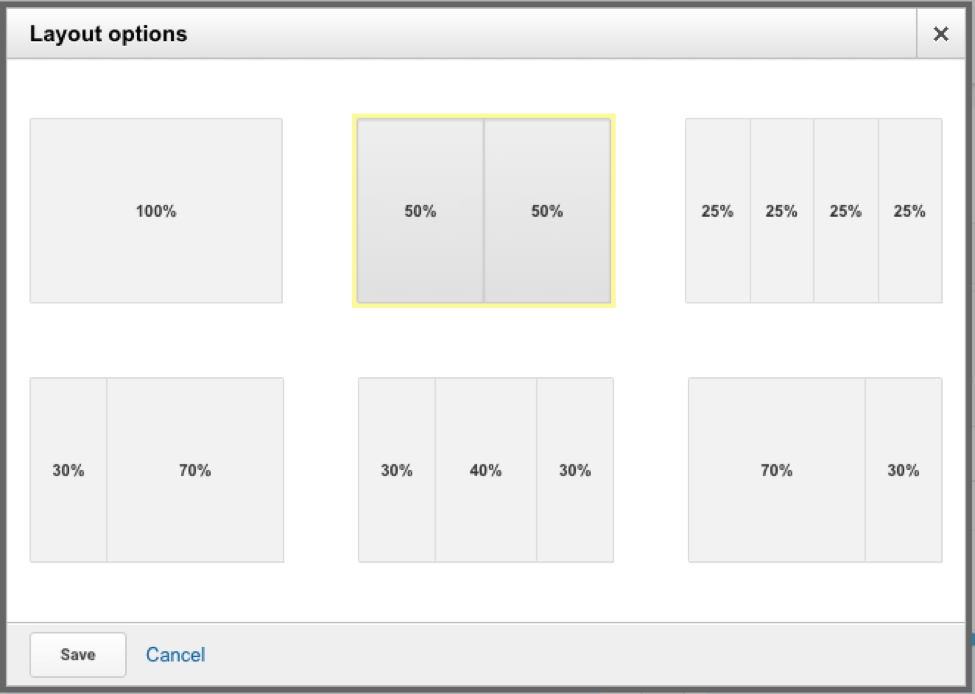
You can also customize the layout of your dashboard:
Useful Dashboard Examples
You can create many dashboards to suit your business and industry, but here are a few examples for helpful overviews.
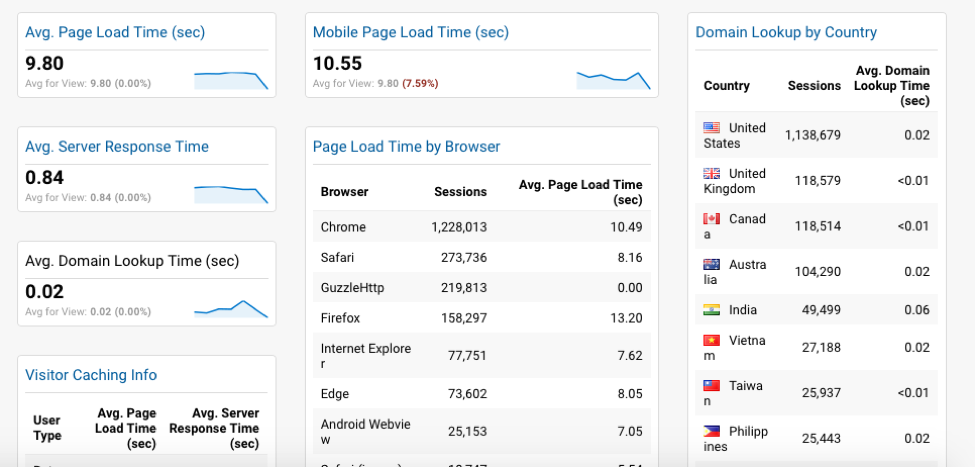
Site Performance Dashboard
The Site Performance dashboard can help you identify problems on your site with page load times, bounce rates and more:
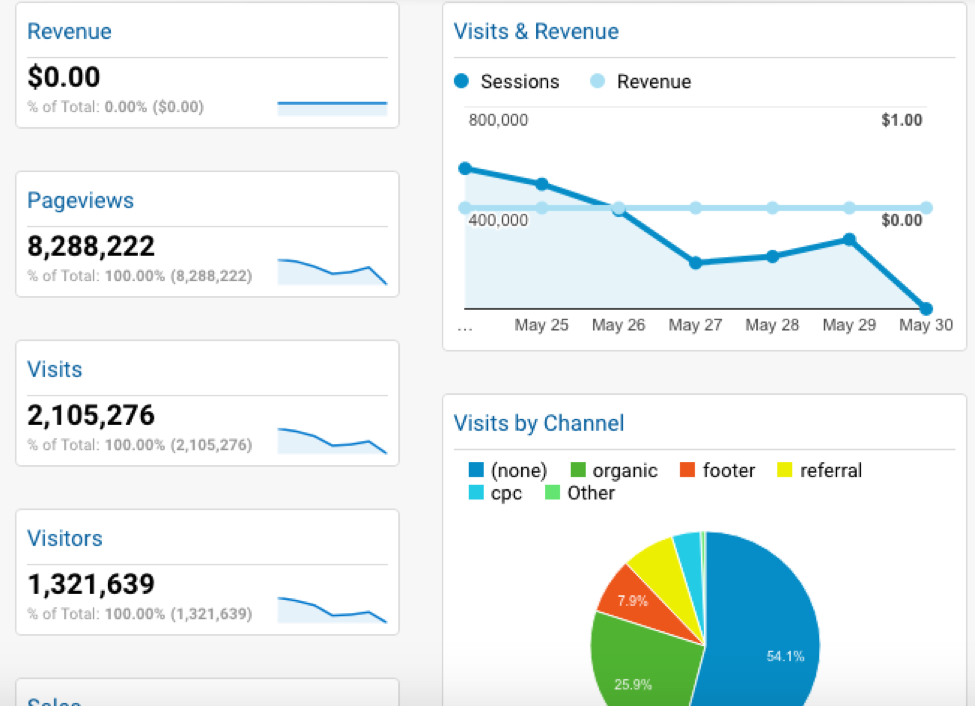
ECommerce Dashboard
If you have an online store incorporated with your site, an eCommerce dashboard is great to see sales and cart optimization at a glance:
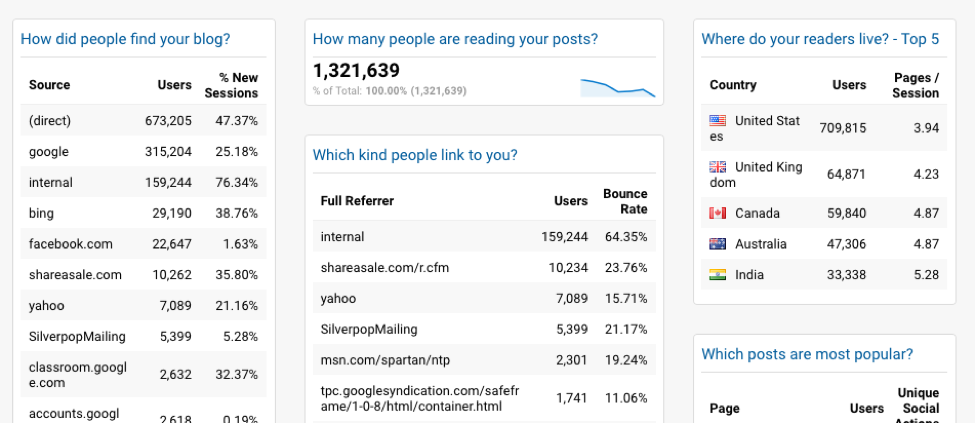
Content Dashboard
The content dashboard is a fantastic resource for content-heavy sites and blogs. This overview shows you the top posts, traffic sources to your blog, and more metrics that will help you optimize your content strategy:
Once you get the hang of creating widgets and setting dimensions, you can customize your dashboards to reflect the data that is most important to you.